
Coin Graphics in PowerPoint
As the saying goes, “Money makes the world go round.” Money plays an essential role in practically all professions and businesses, and its symbolism is powerful. Currency graphics are a great way to present facts and figures in a variety of contexts.
Coin graphics offer an attractive alternative to the stuffy, tried-and-true financial graphics. They are an excellent design element, not only for presentations involving banks, the stock exchange, or finance in general, but also for company accounting and bookkeeping. Cash and balance sheet images also work well in presentations on sales, profits, income and expenses, and taxes. These interesting and unusual diagrams are sure to grab your audience’s attention.
There are many ways to use coin graphics in presentations:
- Stacks of coins of different heights along with arrows can be used to highlight financial developments.

- Coins serve as powerful symbols in finance and banking and immediately put the focus on finances, costs, sales, or related content.

- Presentations are often weighed down with diagrams and tables that overwhelm the audience with confusing figures. Coins distinguish themselves from other graphics by delivering the core message simply and clearly.

Looking for professional coin graphics?
You can find the graphics described above and more in our PresentationLoad online shop and at charteo:
Financial Concepts PowerPoint template in flat design
Template: Hand-stacked coins of different heights
Template: Uneven stack of fifteen British pound sterling coins

- The images can be easily copied and moved.
- Simply select the coins and insert them into PowerPoint.
- Position the coins as desired and adjust their height and size if necessary.
- To change the alignment of the coin stacks, select all coins and click Align under Drawing Tools > Format.
Coin graphics can also be used to enhance financial cycles. Lines and arrows can be used to represent earnings, and varying the thickness of lines can illustrate different financial flows. Coin graphics are an excellent way to graphically support your content and enhance your presentation’s visual appeal.
It’s also easy to draw curves over the coin stacks:
- Select a curve by clicking Shape tab on the Insert tab.
- Click on the point in the image where you want the curve to start.
- The curve can now be moved with the mouse. Click again at the points where you want to add the curve.
- Double-click when you have finished drawing the curve.
Share this post


-

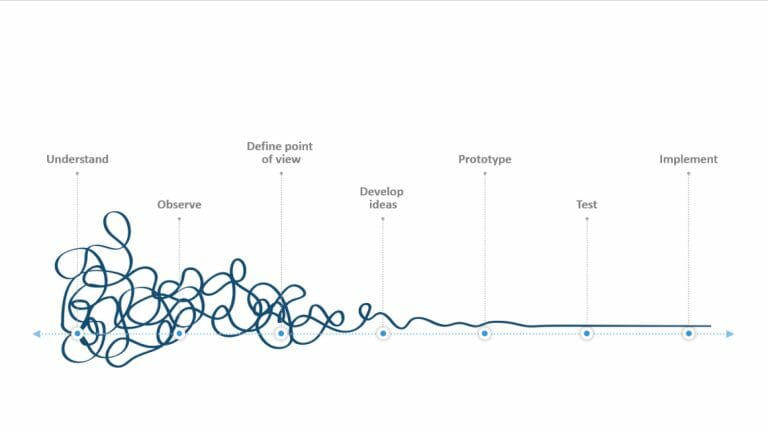
Design Thinking: Problem Solving with a Difference
-
Why Corporate Mission Statements Are So Important
-
7 Tips & Learnings from the Apple Keynote


-
Design Thinking: Problem Solving with a Difference
-
Why Corporate Mission Statements Are So Important
-
7 Tips & Learnings from the Apple Keynote