Create PowerPoint Flowcharts: Tips and Tricks
A flowchart allows you to present complex processes clearly. Flowcharts’ greatest strength is the fact that they make processes easier to understand than wordy descriptions. PowerPoint flowcharts can be a big asset in presentations. By combining shapes, text, and arrows, a flowchart can contain everything from step-by-step instructions to the development of ideas.
The history of flowcharts
Flowcharts were created as far back as the 1920s, when two industrial engineers presented the term flow process chart to the American Society of Mechanical Engineers (ASME). In the 1930s, flowchart tools were used to visualize methods for working more effectively. Procter and Gamble began using flowcharts in the 1940s. During the same time, this type of diagram became the cornerstone of computer program design and grew in popularity.
With advancing modernization and technical innovations, the flowchart has become widely accepted. A hundred years after its initial creation, the flowchart is still a universally accepted to describe and explain processes.
What is a flowchart?
Simply put, a flowchart is a way to illustrate business processes. More specifically, flowcharts are a way to illustrate a variety of processes in detail. The key is that it provides an audience with a quick and easy overview of a process.
Flowcharts illustrate how different process steps are connected with each other, which information is required for which steps and how input is converted to output.
Flowcharts are found in a wide variety of PowerPoint business presentations. Thanks to their versatility, they’re a popular tool for visualizing complex structures and processes.
Advantages and disadvantages of flowcharts
There are numerous advantages in using flowcharts at work:
- Processes, process steps and collected data can be monitored and optimized more easily.
- Processes can be analyzed and improved.
- Current workflows, documents and resources can be mapped collectively.
But there are a few disadvantages:
- The flowchart may become confusing if the process is overly complex
- An audience may have difficulty seeing the entire process, as a flowchart primarily presents sub-processes.
- Since flowcharts have a linear structure, it can be complicated to display parallel sub-processes.
Symbols and functions
For various types of processes and sequences, different symbols are used in flowcharts. The continuous process is typically represented with arrows in a flowchart. Additionally, branches, yes-no decisions, loops, and more can be better depicted using other symbols.

Types of PowerPoint flowcharts
Flowcharts are used in a wide range of fields and industries and are a popular visualization tool for complex processes. We’ll introduce you to the most common types of flowcharts and how to use them.
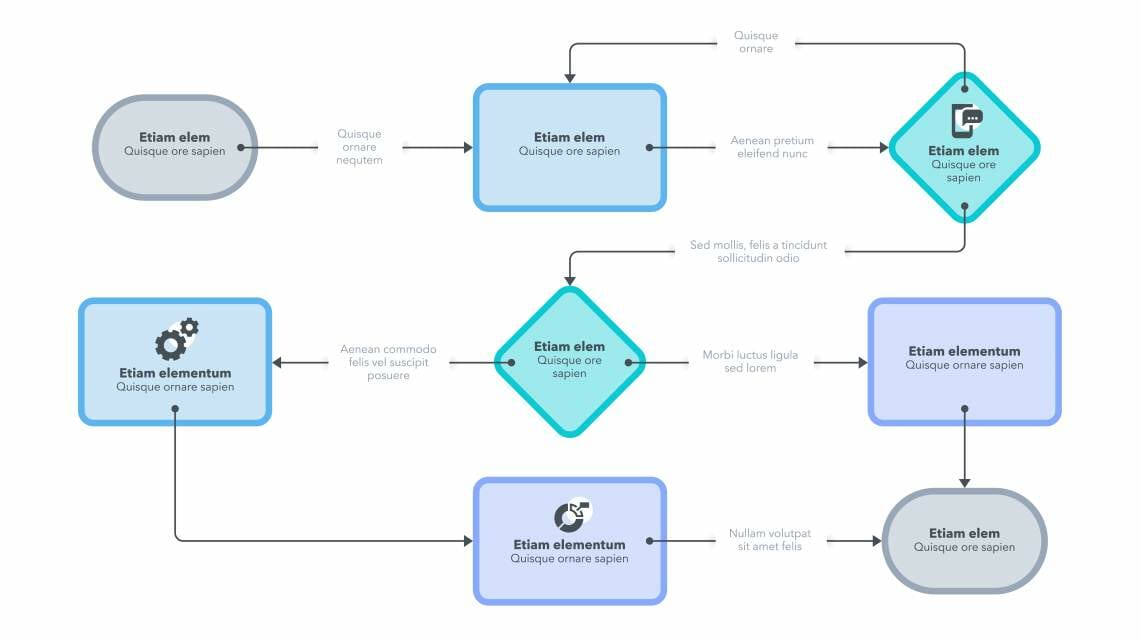
1. The standard flowchart
Flowcharts illustrate the sequence of steps in a process. They visualize the movement of information, tasks, money, people or objects within a process or organization.

Feel free to use PowerPoint templates for a standard flowchart from PresentationLoad:

2. Pools and swim lanes
Swim lane flowcharts can be used to categorize different organizational units and process steps. For example, a swim lane can be used to visualize the employee or department responsible for a specific process. Several swim lanes create a pool diagram. Swim lanes can be vertical or horizontal.

Feel free to use PowerPoint templates for a standard flowchart from PresentationLoad:

3. Workflow diagram
A workflow diagram focuses on visualizing tasks and decisions. Each decision results in a sequence that determines the subsequent path along the flow lines in the diagram.

Feel free to use PowerPoint templates for a standard flowchart from PresentationLoad:

4. Process flow diagram
Process flow diagrams are used to plan and design an entire process. For example, the movement of a product through a company – from development to production to delivery – can be planned and tracked. Process flow diagrams are a valuable tool for quality assurance.

Feel free to use PowerPoint templates for a standard flowchart from PresentationLoad:

5. Data flow diagram
A data flow diagram represents the flow of data within a process or system. Its focus is on the flow of information – where data comes from, where it goes and how it gets stored.

Feel free to use PowerPoint templates for a standard flowchart from PresentationLoad:

6. Specific and standardized flowcharts
Many areas of IT used standardized, specific forms of flowcharts. They include the BPMN diagram, the IDEF0 diagram, the EPC diagram, the SDL diagram and the Nassi-Shneiderman diagram.
Manual vs. Automatic: Creating Flowcharts in PowerPoint
There are various methods to create a flowchart in PowerPoint. You can create a flowchart manually or use the SmartArt function. If you have limited experience with flowcharts, you can expedite the process further by using our PowerPoint flowchart templates:

Tutorial 1/2: Manually Creating Flowcharts in PowerPoint
- Plan Your Flowchart in Advance
What exactly do you want to visualize? What purpose should the flowchart serve? Do you have all the necessary information? Clarifying these questions in advance will save you valuable time when creating your flowchart.
Additionally, having a clear idea of the desired end result will be beneficial. Especially for more complex diagrams, it makes sense to sketch out your intentions and ideas beforehand to have a roadmap to follow during the final implementation.
2. Choose and Place Shapes for Your Flowchart
To select shapes in PowerPoint, go to the “Insert” tab at the top of the screen and click on “Shapes.”

There, you can choose from various shapes for your flowchart. Practical options include squares, wide arrows, or circles. In the “Flowchart” subcategory, PowerPoint also provides some helpful shapes to expedite the creation of your custom flowchart.

If you need a shape multiple times, you can copy it with Ctrl+C and then paste it with Ctrl+V. Alternatively, you can use the shortcut Ctrl+D (Duplicate). To insert text boxes into the shapes, simply double-click on the corresponding shape or go to the “Insert” option and choose “Text Box” again. You can place a text box anywhere and adjust its size as needed.
3. Arrows and connecting lines for your flowchart
Connect your shapes to illustrate which elements are related or follow each other. Insert arrows or lines for this purpose. Once again, go to “Insert” and click on “Shapes.” Here, you’ll find a selection of arrows, block arrows, and various connector lines.
After inserting them, drag the arrows or lines to the appropriate positions using your mouse. When you get close to a shape, small anchor points will appear for better alignment.

Here are some additional tips and official Microsoft guides on creating flowcharts that you can find in this video.
Tutorial 2/2: Automatically Create Flowcharts Using PowerPoint SmartArt
1. To use “SmartArt,” click on the “Insert” tab, then go to “Illustrations,” and select “SmartArt.”

2. In the now-open SmartArt window, choose the appropriate template for your specific project. On the left side, you’ll find various diagram categories. In the “Process” section, you’ll see many of the most common flowchart options. Feel free to explore different SmartArt templates until you find one that suits your needs.

3. Customize Your SmartArt: After selecting a version of the SmartArt flowchart, you can customize it as needed. To do this, highlight the SmartArt you want to modify, and then click on the “SmartArt Design” tab at the top of the PowerPoint window.

You can freely modify or customize the color scheme, format, and layout of your new SmartArt flowchart here to match your preferences.
4. To label the shapes in your SmartArt, simply double-click on the respective shape. Alternatively, you can insert a “Text Box” from the “Text” category in the “Insert” tab. These text boxes can then be freely placed on your slide and resized or adjusted as needed to fit the available space.
To expand SmartArt by adding or deleting fields in the flowchart
- First, select the SmartArt graphic to which you want to add a field.
- Next, select an existing field that is closest to the position where you want to place your new field. Double-click on the field to open the “SmartArt Design” tab. Alternatively, you can find this tab in the toolbar above.
- In the “Create Graphic” section, open the “Add Shape” dropdown menu by clicking on the small arrow next to it.

Here, you will be presented with various options. You have the option to click “Add Shape After” to insert a new field on the same level behind the selected shape. You can also insert a new field before the selected one by choosing “Add Shape Before.” To delete a field, select it and then press the Delete key (usually labeled “Del” or “Delete”) on your keyboard.
Pro Tip: Animate Your SmartArt Flowchart
When creating your flowchart in PowerPoint using PowerPoint SmartArt, you can highlight individual fields by animating your diagram. Here’s how to do it:
- Start by selecting the SmartArt graphic you want to animate.
- In the “Animations” tab, open all the available animation effects in the “Animation” subcategory. You can open the dropdown menu by clicking on the small arrow located to the right of the animation effects.

3. Here, you can freely choose from a wide range of animation effects and add them by clicking. In the “Effect Options” (also next to the “Animation” subcategory), click on “After Previous.”

Important: You can also adjust the timing/delay of each animation in the “Animations” tab. In the “Timing” subcategory, you have various options. The “After Previous” effect will work only if you have set at least a minimal delay.
Conclusion: Use flowcharts to clearly visualize your projects
Flowcharts are ideal for presenting larger processes in both a detailed and clear manner. Unlike extensive descriptions, the strength of flowcharts lies in making complex processes easily understandable, and they can be created effortlessly even by inexperienced PowerPoint users.
Are you looking for professionally designed flowchart templates that align with current trends? Then feel free to visit our shop, and don’t hesitate to contact us at [email protected].
You might also be interested in these articles:
Share this post


-

Design Thinking: Problem Solving with a Difference
-
Why Corporate Mission Statements Are So Important
-
7 Tips & Learnings from the Apple Keynote


-
Design Thinking: Problem Solving with a Difference
-
Why Corporate Mission Statements Are So Important
-
7 Tips & Learnings from the Apple Keynote