
Graphics: An Interesting and Memorable Way to Present Facts and Figures
Many presentations include figures such as sales increases, price developments or statistics. If you just read these out, you risk them sliding straight past your audience’s attention. Since such key figures can be extremely important for the future of the company and influence strategic decisions, it can really help to underline them visually.
A Picture Says a Thousand Words
We’ve written before about how important pictures are for presentations. The human brain has been scientifically shown to retain images much better than text, as images have an emotional component. The best way to make sure that essential facts and figures stand out is to combine them with images.
Professionals know that using straight text, even with underline or bold, can never make such a strong impact; they therefore rely on images when it’s essential to attract and keep an audience’s attention.
We have created two examples for you to illustrate how much more effective a graphic slide is than straight text, and how to create associations between business ideas and images.
Example 1: SMART Goals and Targets

This graphic neatly links goals, precision and setting targets. The image reinforces the associated content and stays in your audience’s heads.
SMART is an acronym for the characteristics that define good goals: Specific, Measurable, Achievable, Realistic and Timed. Goals which meet these all these requirements stand the best chance of being achieved. Our slide emphasizes these characteristics visually, and so strengthens the idea.
Targets can also be used as symbols when talking about achieving goals. As a company your aim is to hit the bull’s eye and achieve all your goals; this is graphically and clearly represented.
Example 2: Mountain Infographics

Processes and multi-phase projects can be likened to a mountain hike: step by step, the team works its way towards the summit (the final product or process). The graphic of a mountain here is used to symbolize milestones and progress in general, because like a long-term project, a mountain hike needs planning, perseverance, and experience.
This mountain path graphic, like the target in Example 1, uses the similarities between the ideas to anchor the key facts in the audience’s memory.
You can see how effective graphics are in depicting abstract processes and figures. Linking business ideas with more tangible things such as targets or mountain hikes means that images get created in your audience’s minds – images that they will remember for a long time to come!
Share this post

-

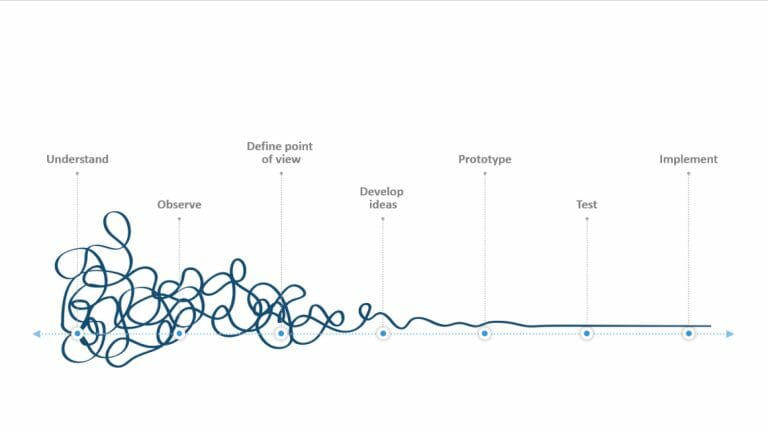
Design Thinking: Problem Solving with a Difference
-
Why Corporate Mission Statements Are So Important
-
7 Tips & Learnings from the Apple Keynote


-
Design Thinking: Problem Solving with a Difference
-
Why Corporate Mission Statements Are So Important
-
7 Tips & Learnings from the Apple Keynote