PowerPoint SmartArt: The All-In-One Tool for Visuals on Your Slides!
These days, most PowerPoint presentations are used to present solutions to problems. This might be in front of management, colleagues or at university.
PowerPoint SmartArt gives users the tools to communicate information using graphics. In this article, we’ll introduce you to several ways you can use PowerPoint SmartArt in your presentation and impress your audience.
What is SmartArt?
Presenting solutions in a clear and interesting way can be a challenge. Audiences often find themselves overwhelmed by overloaded slides and have no idea where to look first.
With PowerPoint SmartArt, users can convey information through graphics.By offering a wide range of styles, SmartArt graphics make it easy to present a variety of facts and information. SmartArt graphics are versatile and can be customized to suit your needs.
Advantages of using SmartArt
SmartArt offers PowerPoint users numerous advantages:
- Saves time: The ready-made designs allow you to create professional presentations quickly and easily.
- Simplicity: SmartArt is easy and intuitive to use – even for PowerPoint beginners.
- Wide selection: A wide range of ready-made SmartArt graphics are available for all kinds of purposes.
- Flexible formatting: All SmartArt graphics are incredibly versatile and can be customized to suit your needs.
- Transferable: SmartArt graphics have been available since one of the very first PowerPoint versions (2007). There are now more than 150 different layouts available for use in Office 365 and you can easily insert them into other PowerPoint versions.
- Visually appealing: SmartArt adds a visual dimension to your PowerPoint slides. These clear and professional graphics guarantee that your slides will be interesting and memorable.
Why SmartArt is Often the Best Methodology
For presentations, there are numerous options for visual representation such as tables, charts, or infographics. However, PowerPoint SmartArt is the most advantageous in most cases.
SmartArt is consistently the optimal solution when it comes to presenting information in a visually appealing and structured manner. Unlike conventional tables or lists, SmartArt enables a clear and aesthetic depiction of relationships, processes, hierarchies, and other complex content. Conversely, charts and infographics often emphasize specific data sets or quantitative information.
Furthermore, SmartArt stands out with a wide array of predefined layouts and designs that facilitate rapid and professional presentation design. Unlike manually creating charts or infographics, which can often be time-consuming, SmartArt provides pre-designed templates that can be customized to meet your individual needs. This saves valuable time and allows you to focus on the content of your presentation.
STAR method

The STAR method hails from the United States and stands for, Situation, Task, Action, Result. Originally developed for job interviews, the method is also used in the business sector to present issues clearly and concisely.
As the name implies, visual elements are arranged in a star shape.
This STAR method slide is part of our SmartArt – Toolbox 2D template, which you can purchase for download. Just click on the image above or follow this link.
How to create a SmartArt graphic using the STAR method:
- Create a slide with the Title and Content layout.
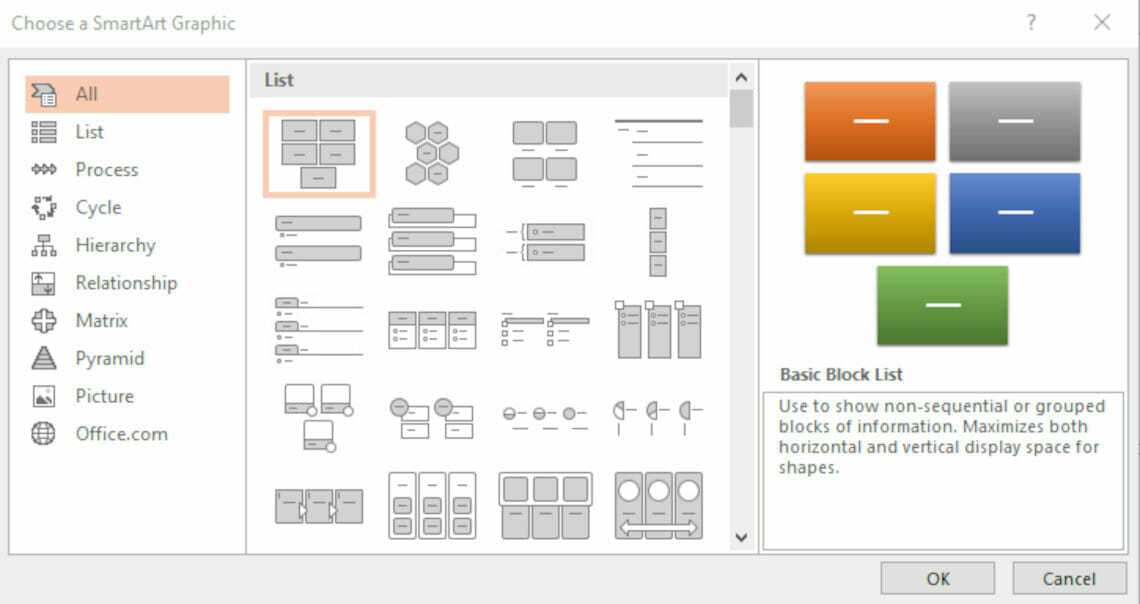
- On the content placeholder, click the icon for inserting a SmartArt graphic. The screenshot below shows you what this looks like.

3. In the dialog box, select Cycle and then Diverging Radial. Confirm your selection by clicking OK.
4. You can now enter your text.
5. You can now customize the SmartArt graphic. You can change font size, shapes and colors, to name just a few.
Problem solving as a process with PowerPoint SmartArt
Problem solving is typically not something that just happens, but a process – a sequence of steps. These steps ultimately lead to a solution. PowerPoint SmartArt offers several effective options for illustrating these steps. Select Process from the Choose a SmartArt Graphic dialog box. You’ll have several different styles to choose from.
For example, you can insert graphics that make your process look like an arrow. You can also select a sequence of steps or a staircase to show the progress of the process. Or, you could present your solution as a formula, which illustrates that specific combination of elements is necessary to solve the problem.
As you can see, PowerPoint provides a wide range of SmartArt graphics. Try out a few to find the perfect one to illustrate your solution to a specific problem.
You can find more inspiration in our SmartArt Toolbox in our web shop.

Lists as graphics
It’s not just processes and problem-solving that can be turned into graphics. SmartArt can also be used to visualize lists. No more boring your audience with basic bullet points.
Find out below how to create lists with PowerPoint SmartArt.
- Insert a text box on your slide and select a list option from the Paragraph group in the Shape Format tab.
- Select the text box and click Convert to SmartArt from the same Paragraph group under Shape Format.
- Now choose from a number of preset SmartArt graphics from the drop-down menu.

4. After creating your graphic, you can add text to your graphic by clicking on .
5. From the SmartArt Styles group, you can choose from additional layouts and change colors.
Bonus tip: Edit individual shapes in your graphic
- Left-click on the shape.
- Select Change Shape under Format. You can now choose the desired shape from the drop-down menu.

Editing pictures with PowerPoint SmartArt
It’s hard to imagine PowerPoint presentations without pictures — they’re essential for holding an audience’s attention. This is why when creating a presentation, a lot of time is usually spent on editing images. Yet few users are aware that there are simple tools available for many complicated editing tasks.
With SmartArt, you can not only adjust image sizes, but also add captions or make collages. In the next section, we will explain one way to use SmartArt for image editing.
- Click Insert > Pictures to add the images you want to your slide.
- Select the pictures with CTRL + left-click. Next, click Picture Layout button from the Picture Format tab.

3. Now you can choose the picture layout you want from the drop-down menu. Once you have made your selection, your pictures will be used to create a SmartArt graphic.
Moving pictures within a graphic
- To move or align images within a SmartArt graphic, right-click on the graphic.
- Select Size and Position from the drop-down menu. Click on Position and use the Horizontal position and Vertical position values to adjust the position of the picture.
- To customize elements within your graphic, click Convert under SmartArt Design, and then click Convert to Shapes.

4. You can now change each shape by clicking on it, going to the Shape Format tab and selecting Edit Shape.
Presentations with high-quality images and organized slides not only make slides easier to read, but are also visually captivating. Try out image editing with SmartArt and see for yourself!
Further Areas Where You Can Utilize PowerPoint SmartArt
We provide several examples below where employing SmartArt elements can streamline the visualization of complex content:
- Organizational Charts: Organizational charts are a frequent application of SmartArt, offering a clear depiction of hierarchies and team structures. SmartArt organizational charts enable you to communicate roles and responsibilities within your company or project, clearly showcasing relationships between different departments and team members. We delve into this in detail in the article “Creating Organizational Charts in PowerPoint.”
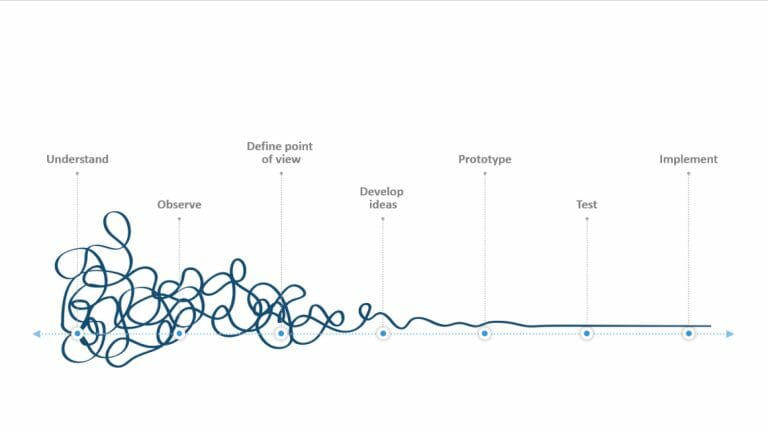
- Timelines: SmartArt timelines are ideal for illustrating project progress, historical events, or business growth. The crisp representation of data points and events creates a coherent chronology, facilitating understanding and analysis of chronological sequences. We explore this in depth in the article “Creating Timelines in PowerPoint.”
- Comparison Tables: SmartArt comparison tables are excellent for juxtaposing products, options, or concepts. They allow for quick comprehension of differences, similarities, advantages, and disadvantages, aiding informed decision-making.
- Hierarchies: SmartArt hierarchy diagrams effectively visualize intricate structures such as company hierarchies or decision pathways. The visual representation of levels and connections enhances the comprehension of relationships and facilitates clear communication.
- Infographics: SmartArt can be harnessed to craft informative infographics. Infographics serve as powerful tools to present complex data and statistics in a visually appealing and easily understandable manner.
Tip: Adding Interactivity to Your Presentation with SmartArt
Whenever possible, consider making your presentations interactive. This helps maintain your audience’s engagement at a consistent level and injects excitement into your talk. Even with SmartArt, you can incorporate interactive elements into your slides. Here are some examples:
- Hyperlinks to Detailed Information: Within a SmartArt graphic, you can place hyperlinks that lead to additional information or detailed explanations. For instance, clicking on a specific shape within the graphic can open a linked slide or an external website that provides extra insights on the topic.
- Interactive Navigation Elements: SmartArt graphics can serve as interactive navigation bars, allowing the audience to navigate between different sections or topics of the presentation. By embedding links to various sections of your presentation within the SmartArt graphic, you can create a non-linear structure and encourage the audience to explore the presentation on their own terms.
- Quizzes or Interactive Polls: SmartArt graphics can also be integrated into quizzes or interactive polls. For example, you can use a SmartArt graphic to present different answer options, prompting the audience to choose the correct answer.
- Interactive Presentation Tools: There are specialized presentation tools and software that can introduce additional interactivity to your presentations. With these tools, you can transform SmartArt graphics into multimedia elements like sliders, pop-up windows, or interactive maps. These elements actively engage the audience in the presentation and create an appealing experience.
For more in-depth tips on interactive elements, you can refer to the article “Interactive Presentations.”
Conclusion: Inspire your audience with PowerPoint SmartArt!
Whether it’s bullet points, images, or processes, all of these can be simplified and streamlined with PowerPoint SmartArt, making your work beforehand much easier. Moreover, harnessing PowerPoint SmartArt can leave a lasting impression on your audience, ensuring that you remain in the memory of many viewers long after your presentation.
Do you have any questions about SmartArt or PowerPoint in general? Don’t hesitate to contact us at [email protected]. We’ll be happy to help you!
Are you looking for professionally designed slide templates as a basis for your presentation? Take a look around our shop. We have numerous slide templates prepared for you on a wide range of (business) topics. Take a look directly! ►To the shop
Other articles that might also interest you:
Share this post


-

Design Thinking: Problem Solving with a Difference
-
Why Corporate Mission Statements Are So Important
-
7 Tips & Learnings from the Apple Keynote


-
Design Thinking: Problem Solving with a Difference
-
Why Corporate Mission Statements Are So Important
-
7 Tips & Learnings from the Apple Keynote